Category: Environmental Infographics
-
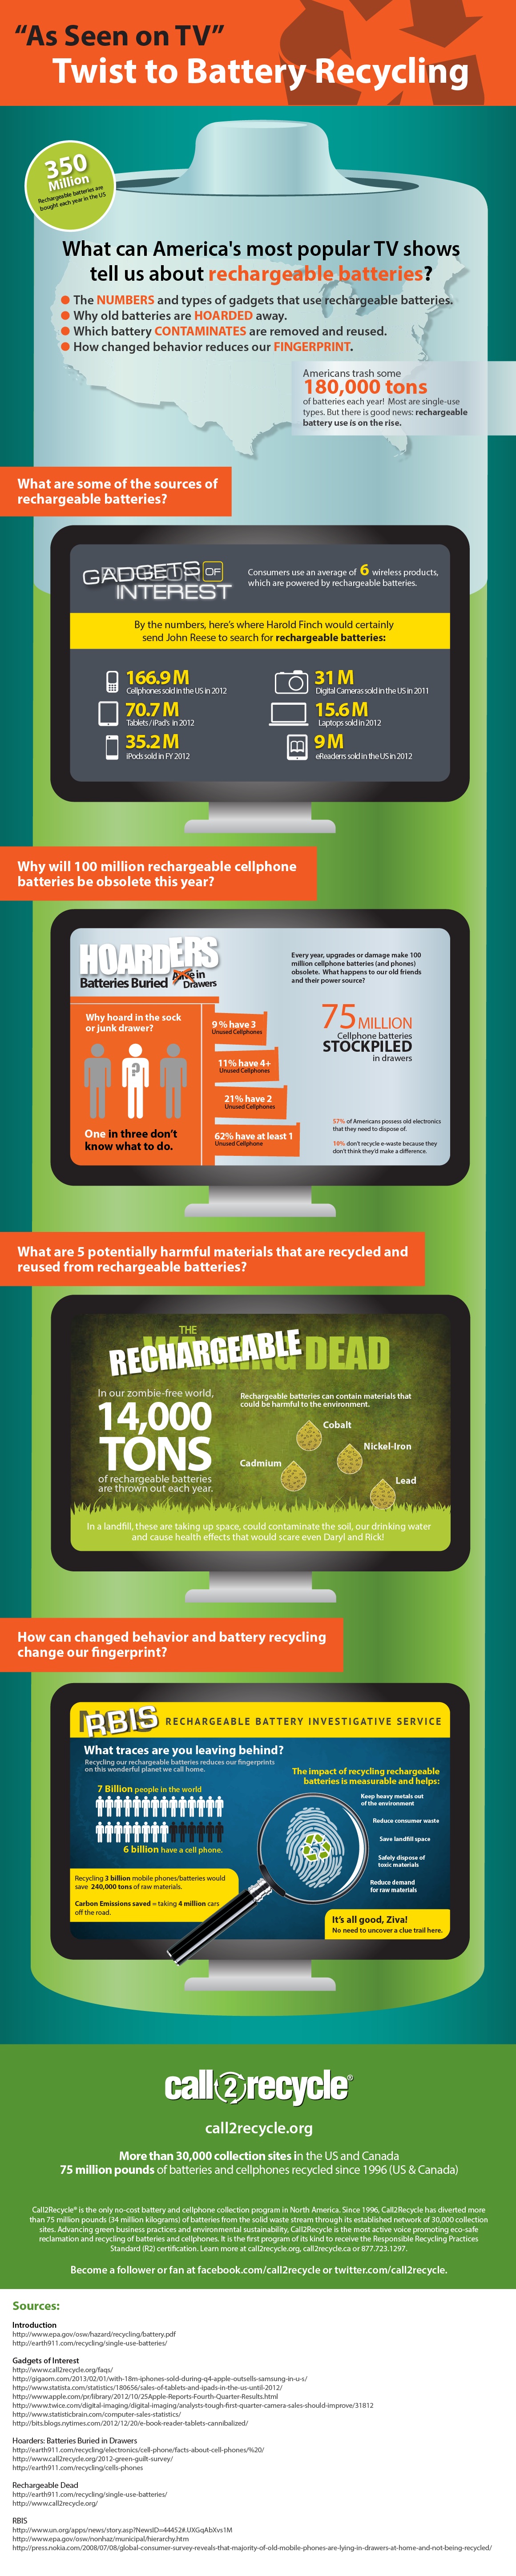
“As Seen on TV” take on battery recycling
“As Seen on TV” take on battery recycling from Call2Recycle educates consumers in a fun way about battery recycling for Earth month.
-

A Visual Guide to Reducing your Home’s Energy Consumption
Taking shorter showers, turning on the ceiling fan and closing the blinds in summer can go a long way to reducing your home’s energy usage. Even with a limited budget to invest in long term energy savings, you can do a lot. Insulating your hot water heater, adding shutters to the windows, insulating your attic…
-
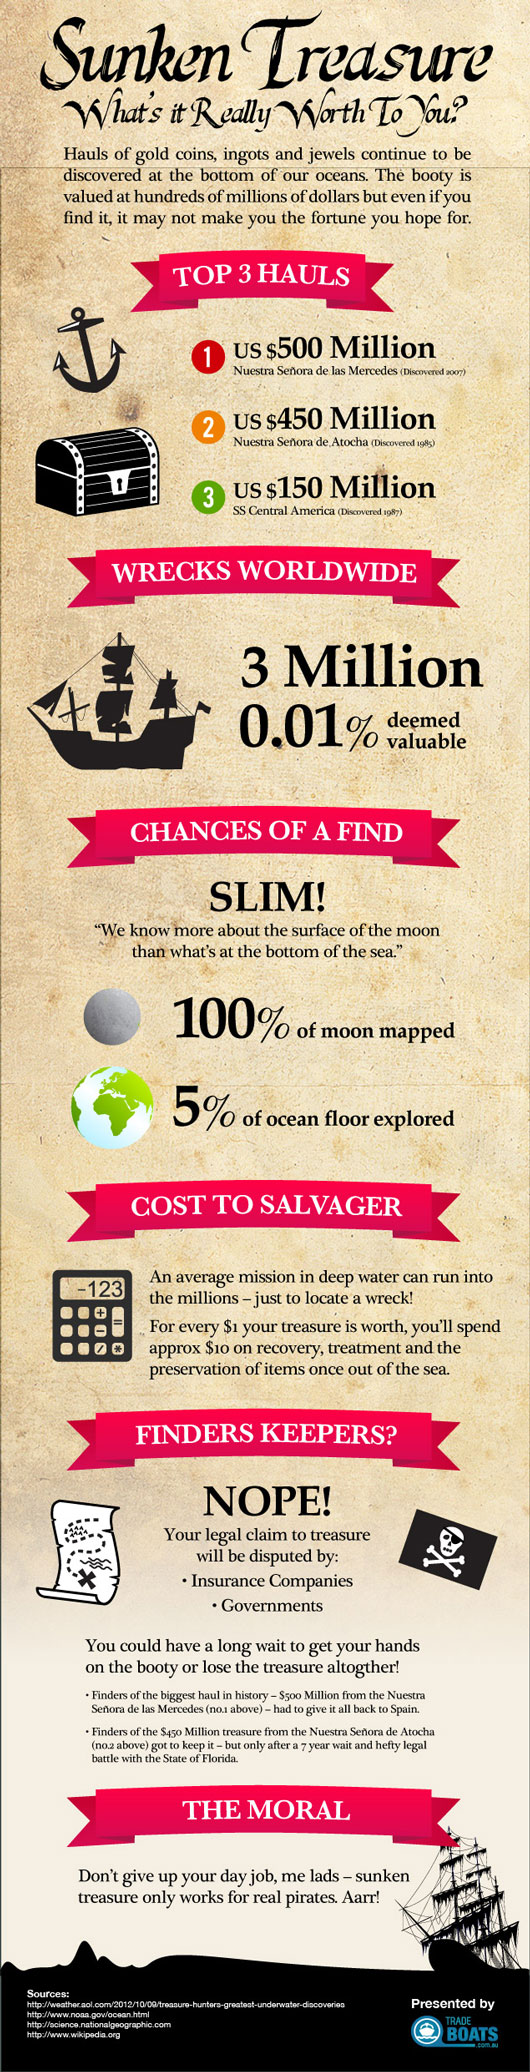
Treasure Hunting
Bought to you by “Trade Boats Australia” this infographic delves into the murky depths of treasure hunting. With hundreds of millions of dollars worth of “sunken treasure” laying on the ocean floor it is no wonder people chase the big haul. But beware, it may not be a case of finders-keepers…
-

50 Unbelievable Facts About Earth
Earth is the largest of the Solar System’s four terrestrial planets. It is around 4.54 billion years old and is home to approximately 7 billion people. Our infographic looks at some of the amazing diversities that make up our planet.
-
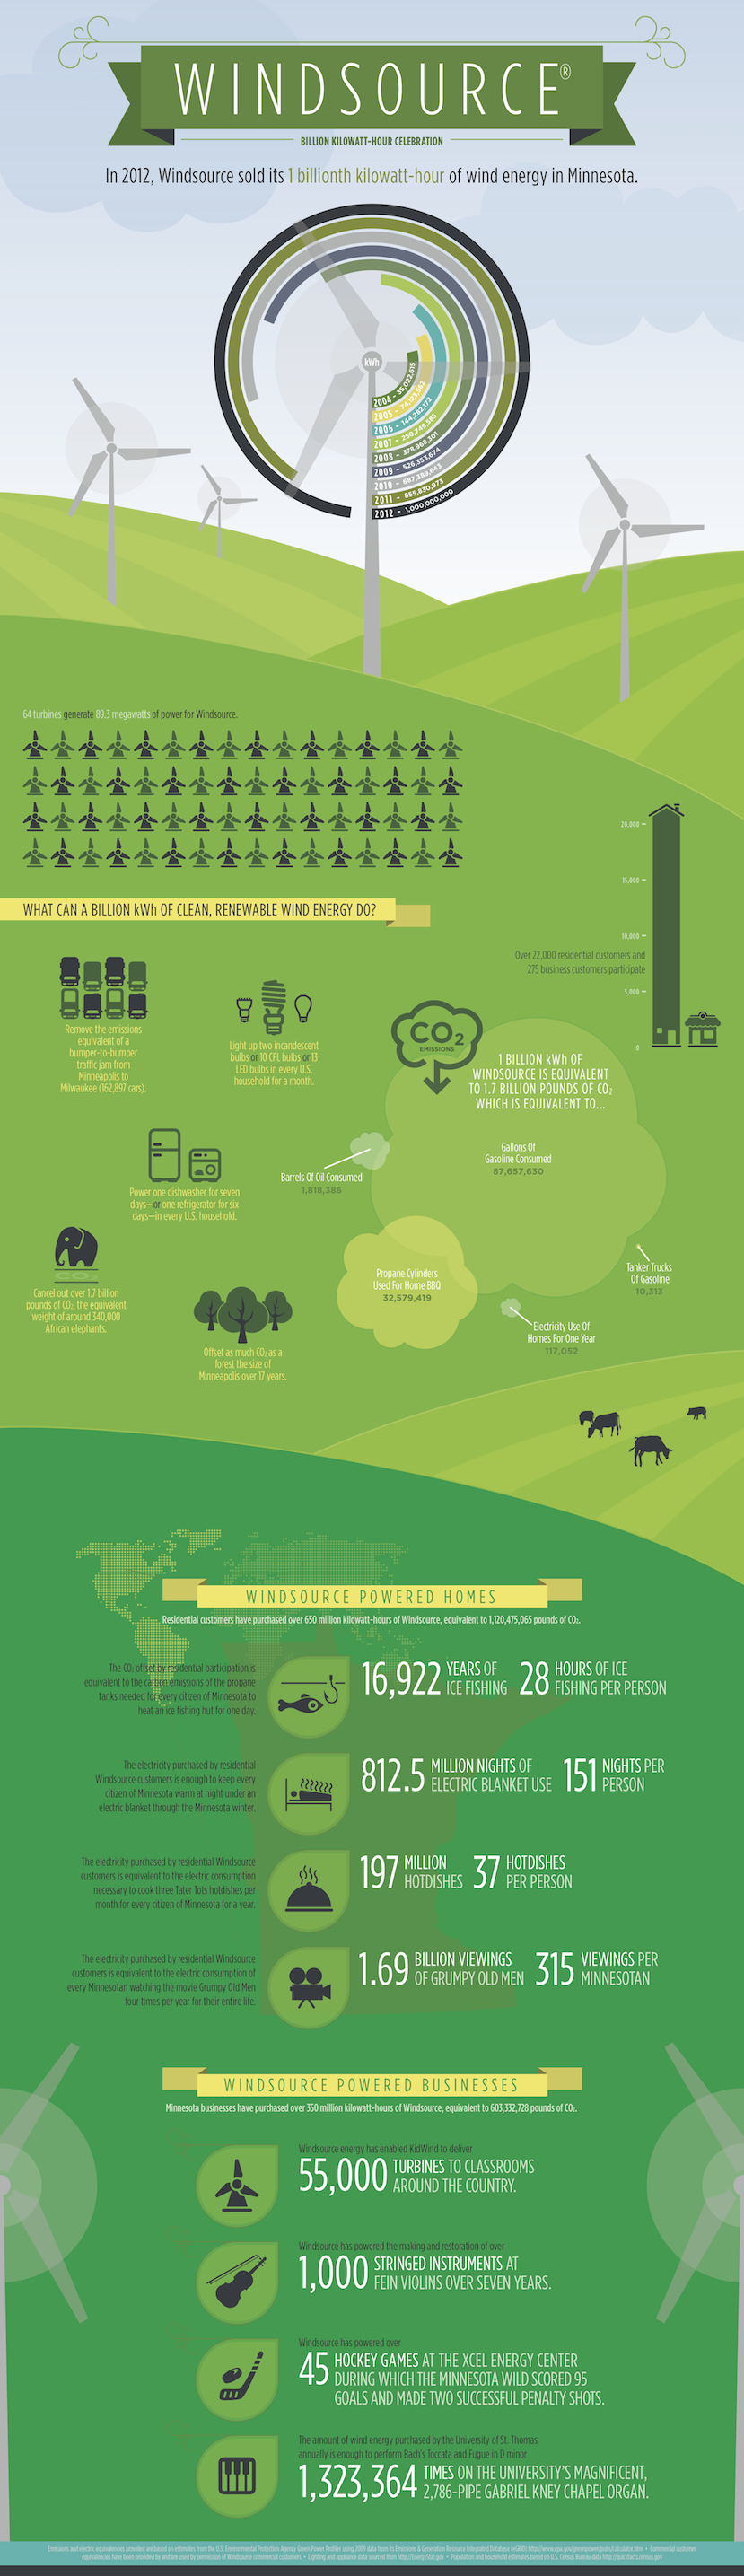
WindSource: The power of renewable energy
Wind turbines in Minnesota have produced enough power to offset the emissions produced by a coal-fired plant equivalent to taking 163,000 cars off the road. That would be a bumper-to-bumper line from Minneapolis to Milwuakee. There’s a lot more that one billion killowatt-hours of power can do.
-
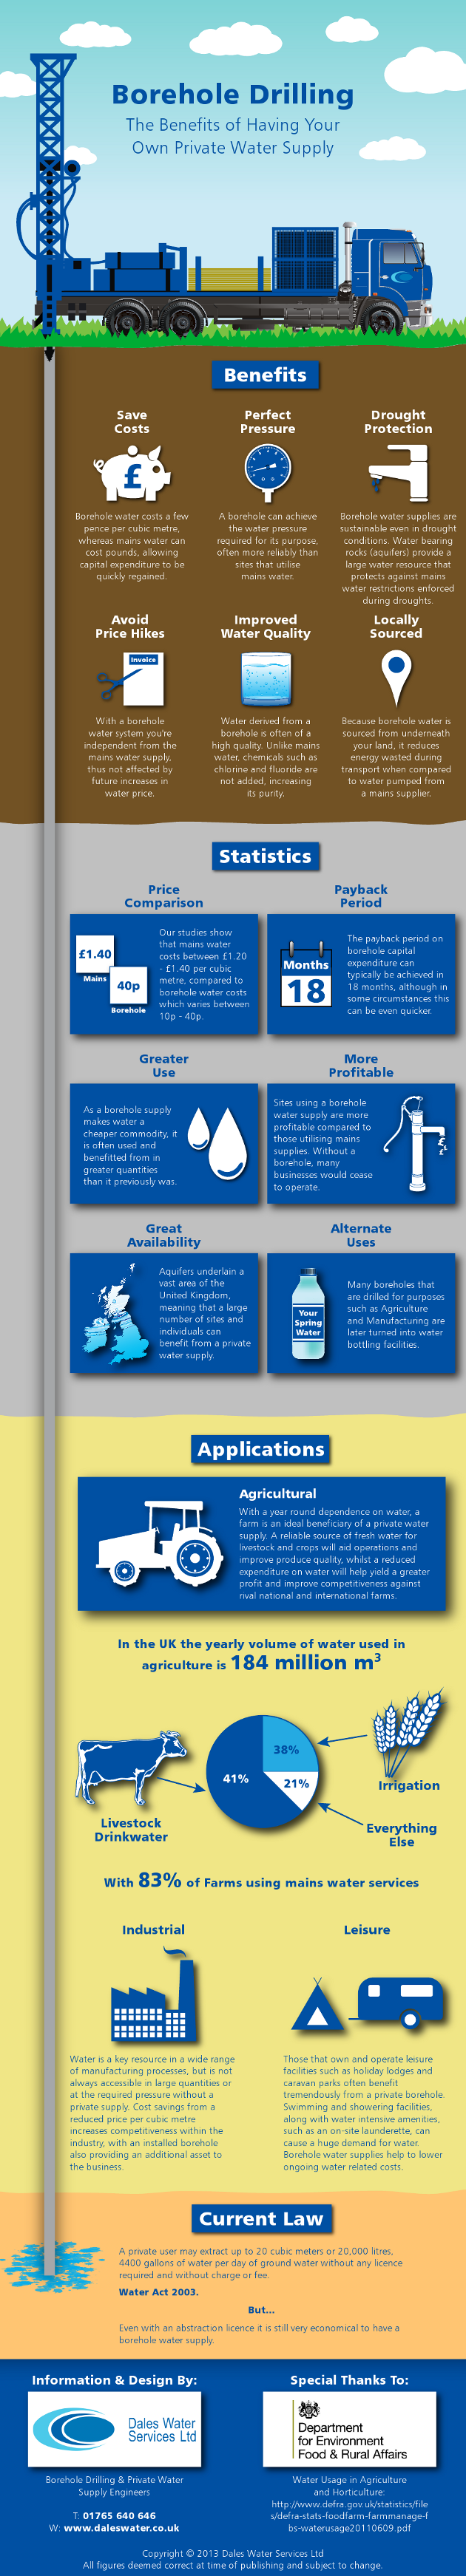
The Benefits of Having Your Own Private Water Supply
Have you ever wondered about the benefits of taking your water supply off mains and tapping into groundwater to power your business or home? Our handy graphic gives you all the benefits of utilising borehole water, the applications of it and how much you’d be likely to save if you were to utilise a borehole.
-
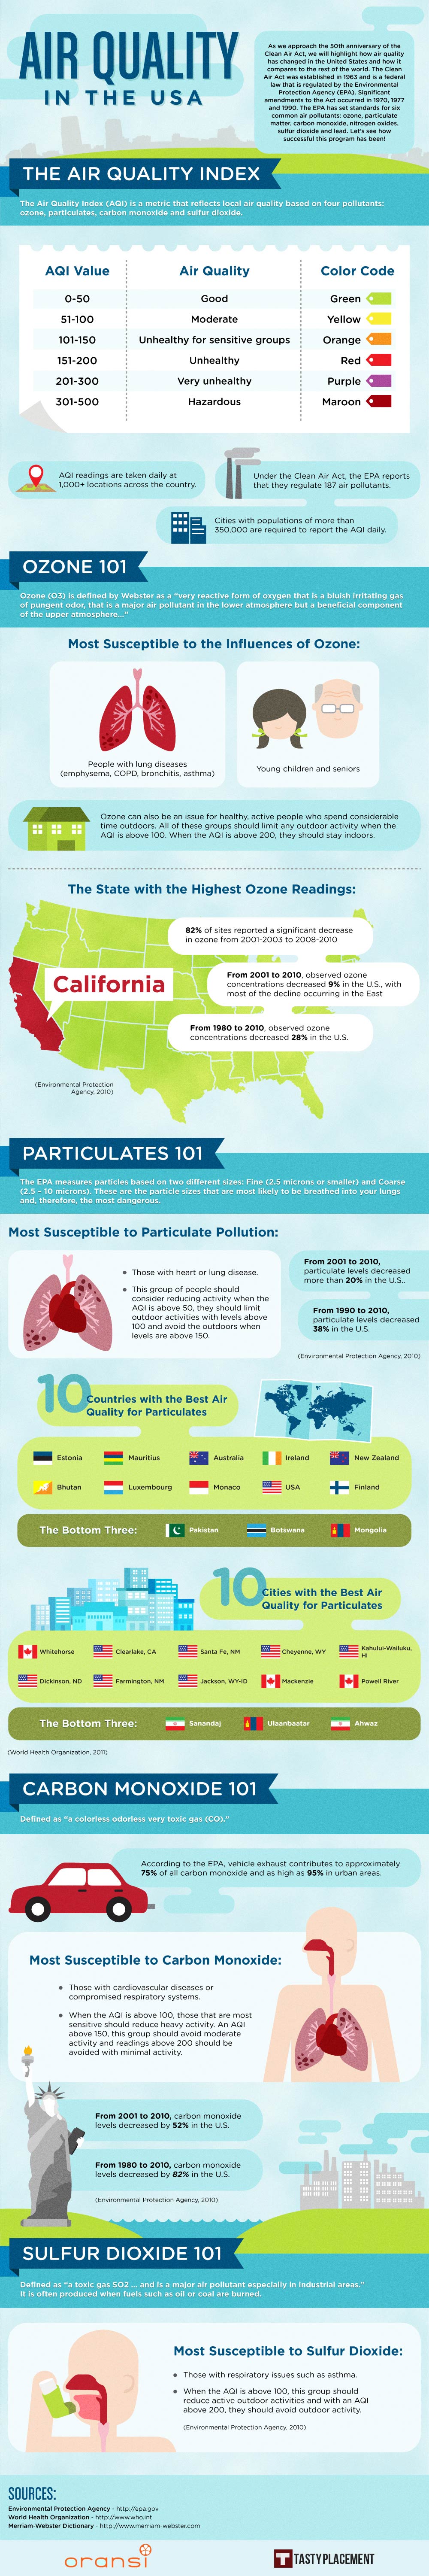
Air Quality in the United States
The Air Quality In The USA infographic has a wide variety of information regarding the air quality index, or “AQI”, which is a measurement of the quality of the air in a given area. AQI readings are taken in over 1,000 locations everyday throughout the United States, and based on the Clean Air Act, the…
-
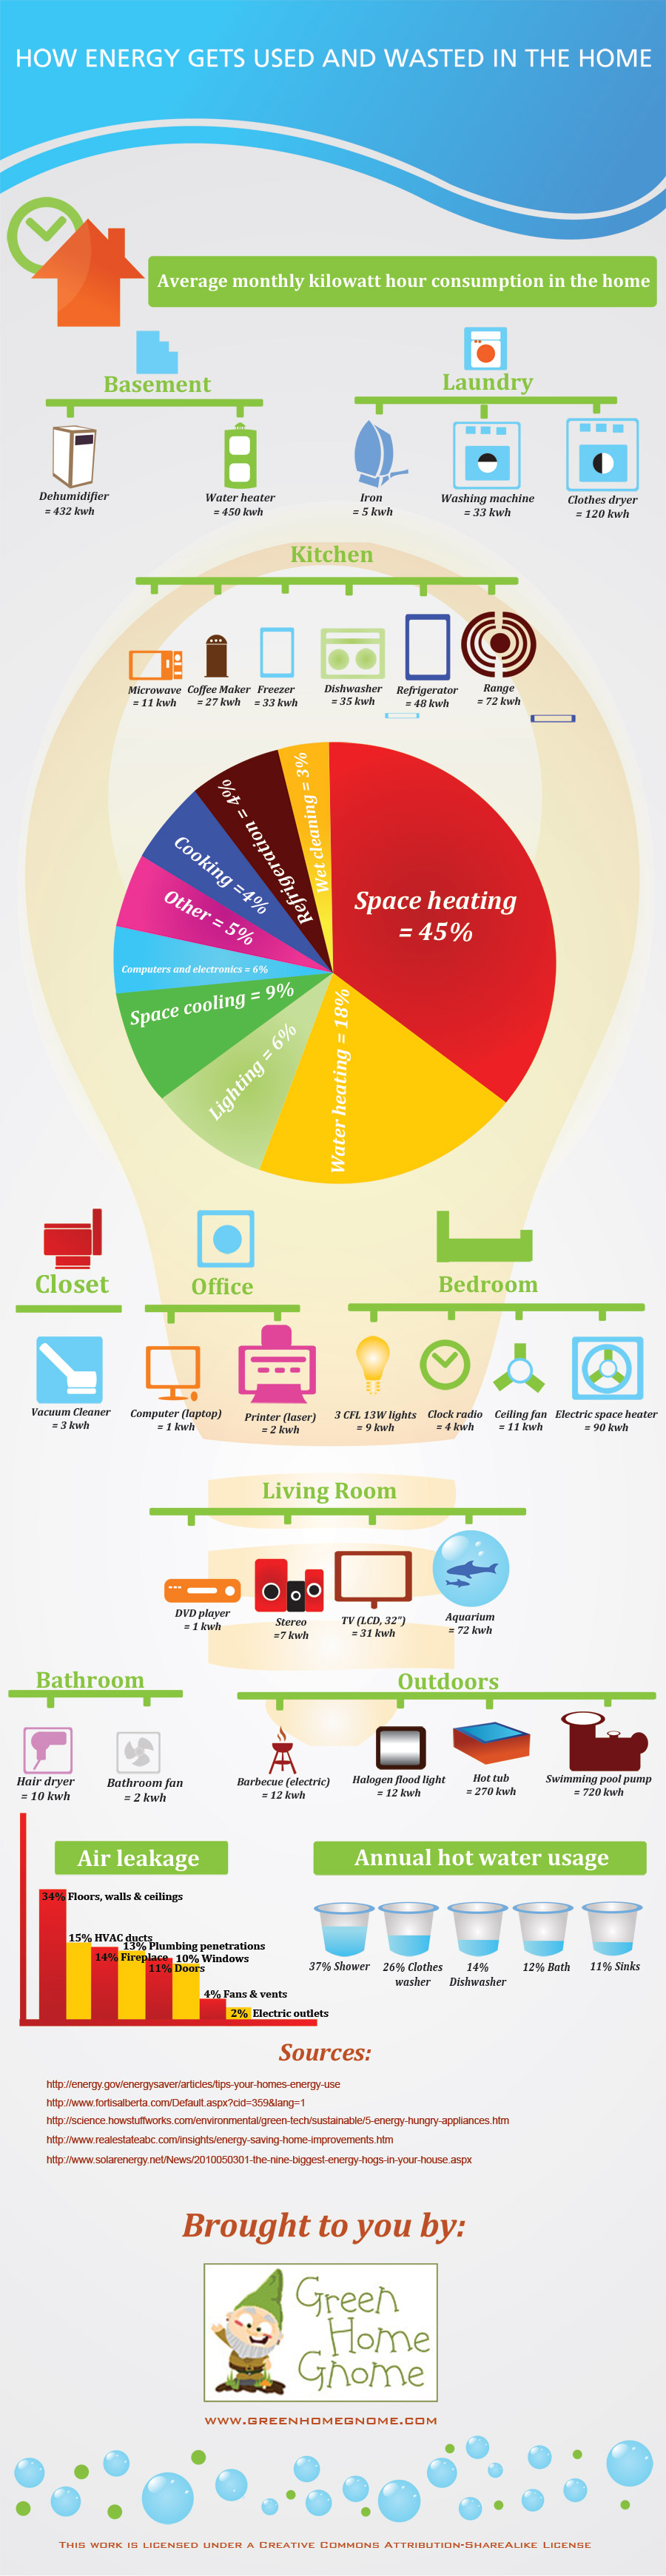
How Energy Gets Used and Wasted in the Home
Buildings account for 50 percent of natural resources, 39 percent of total energy use and 12 percent of water consumption. Yet, so much of this waste. As homeowners, renters, or even as house or hotel guests, we can have a great impact on the Earth by minimizing our energy consumption. Awareness is the key to…
-
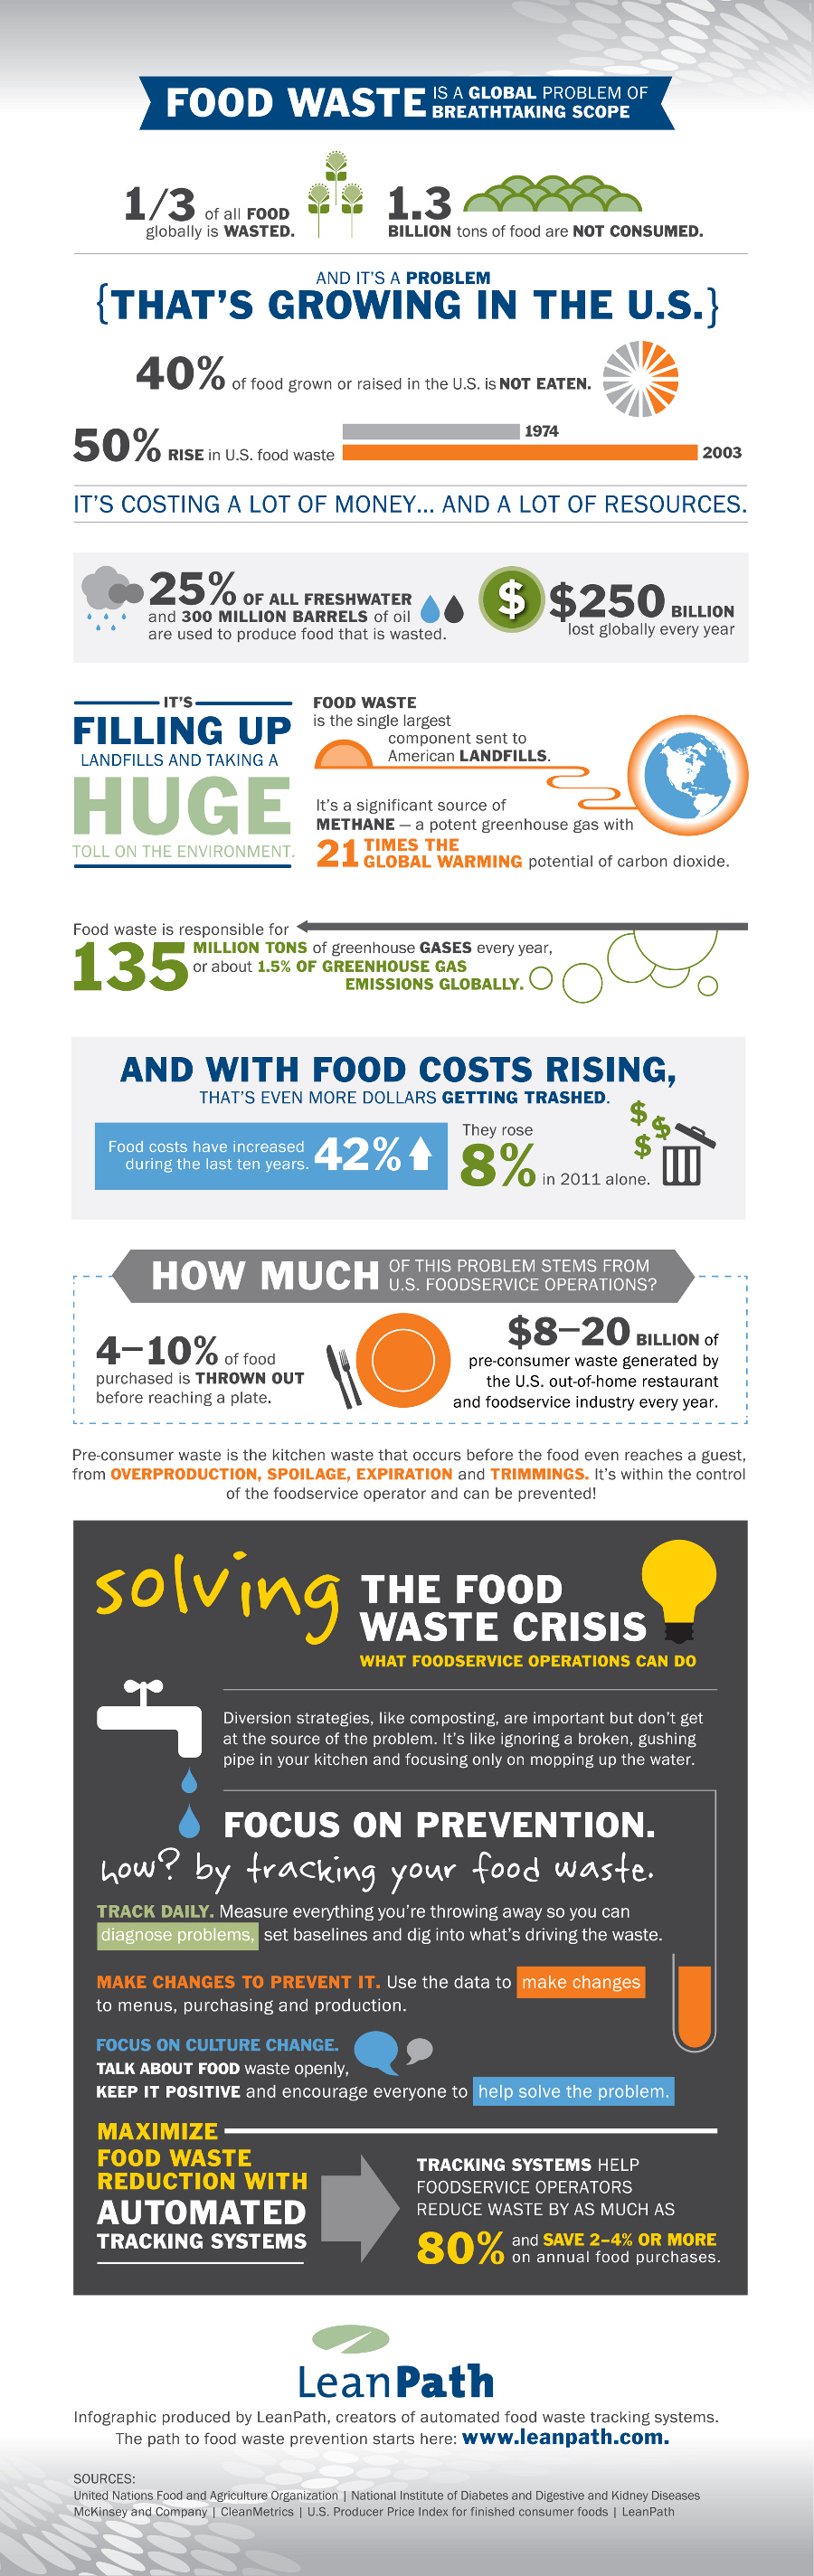
Food Waste Crisis: What Foodservice Operators Can Do
Food waste is a huge problem of breathtaking scope: nearly 40% of the food produced in the US is wasted. This waste has significant financial and environmental impacts. Financially, food costs are on the rise—up 50% since the 1970s—so the food that’s being thrown out has a big price tag. Environmentally, food waste is filling…
-

Never Refuse To Reuse
The amount of trash produced by each American citizen is difficult to imagine.The heaps of trash exert negative influence on the natural environment in so many different ways. One household will probably not make any diference, but if many people follow suit the results will be noticeable. Recycling is an easy and effortless way to…