Tag: statistics
-
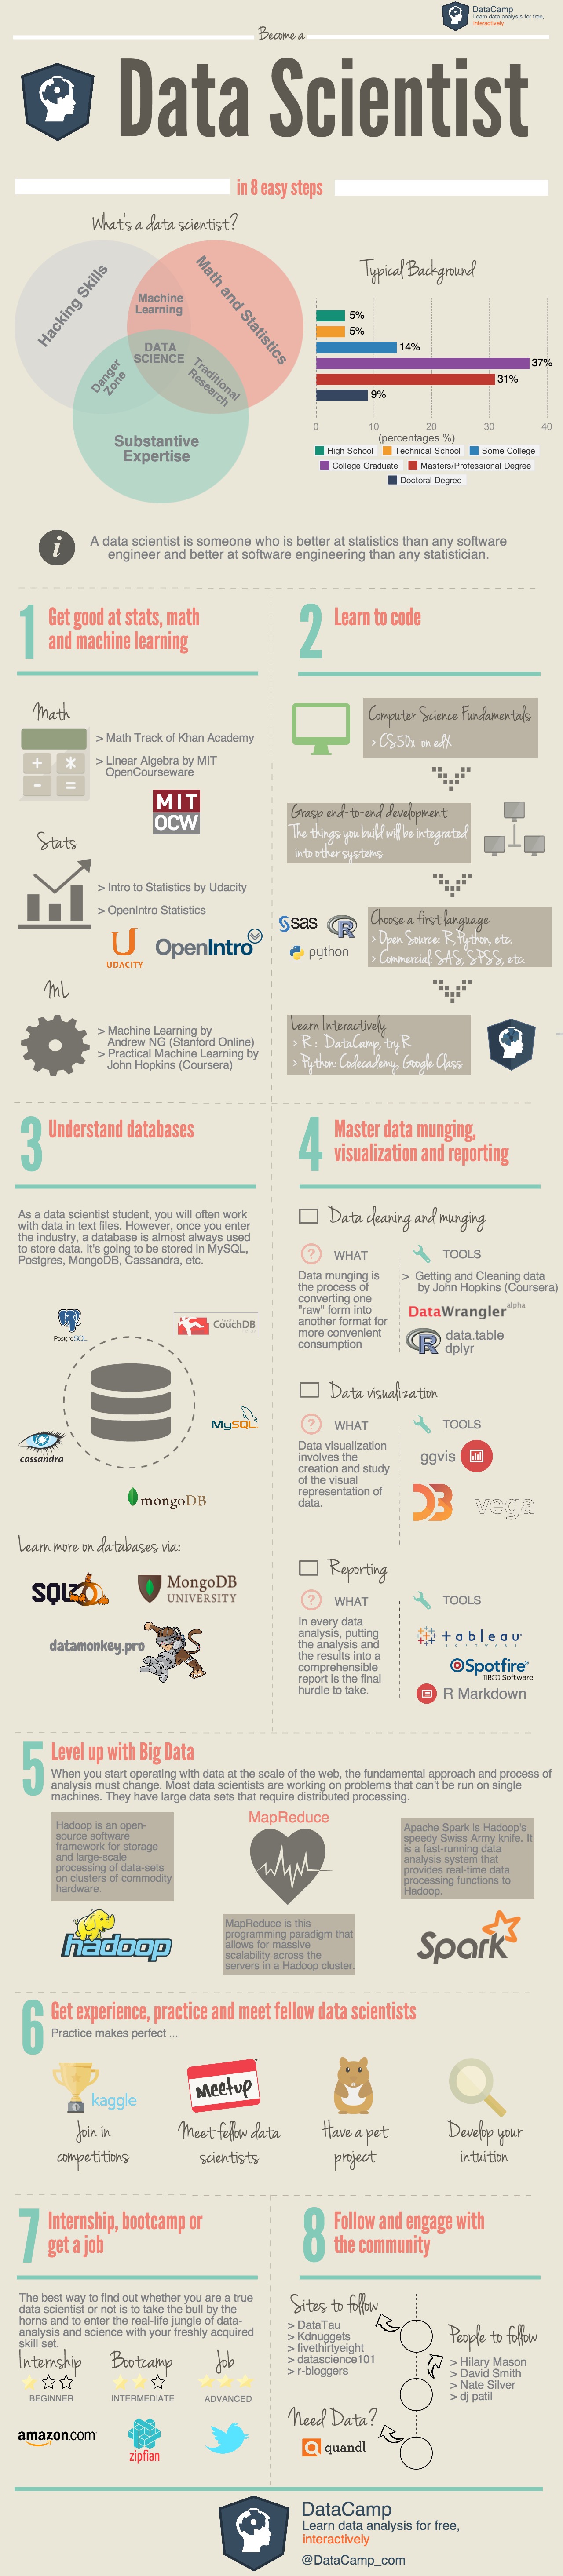
New Infographic: How to become a data scientist in 8 steps
At DataCamp we designed a step-by-step infographic that clearly outlines how you can become a data scientist in 8 easy steps. This visual guide is meant for everyone that is interested in learning data science or for everyone that has already become a data scientist but wants some additional resources for further perfection. Have a…
-
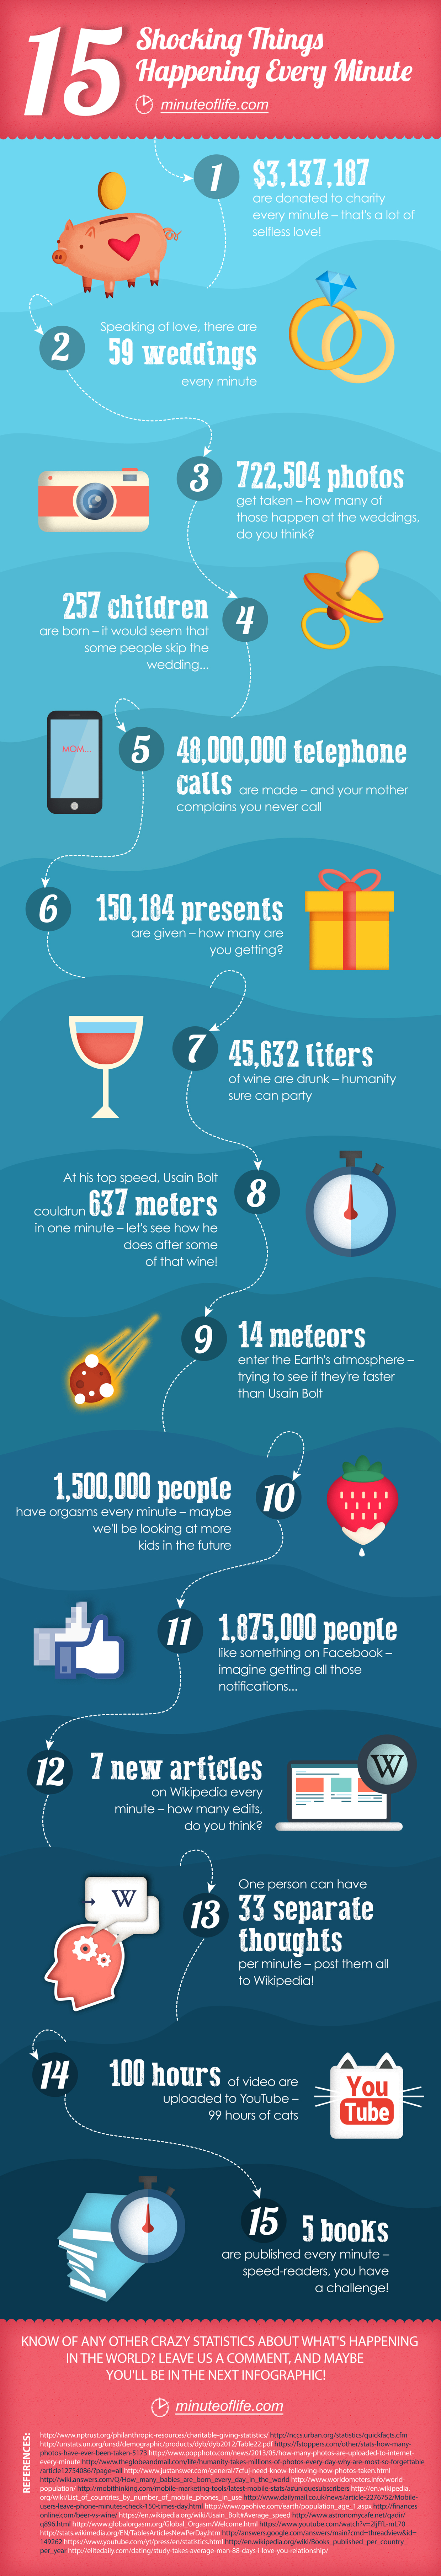
15 Shocking Things Happening Every Minute
Have you ever wondered what’s happening within 1 minute in the world? This infographic reveals 15 intriguing things that occur each minute on the Earth. You’ll discover how many wedding happen, how much money are donated, how many liters of wine are drunk, how many presents are given and even how many meteors enter the…
-
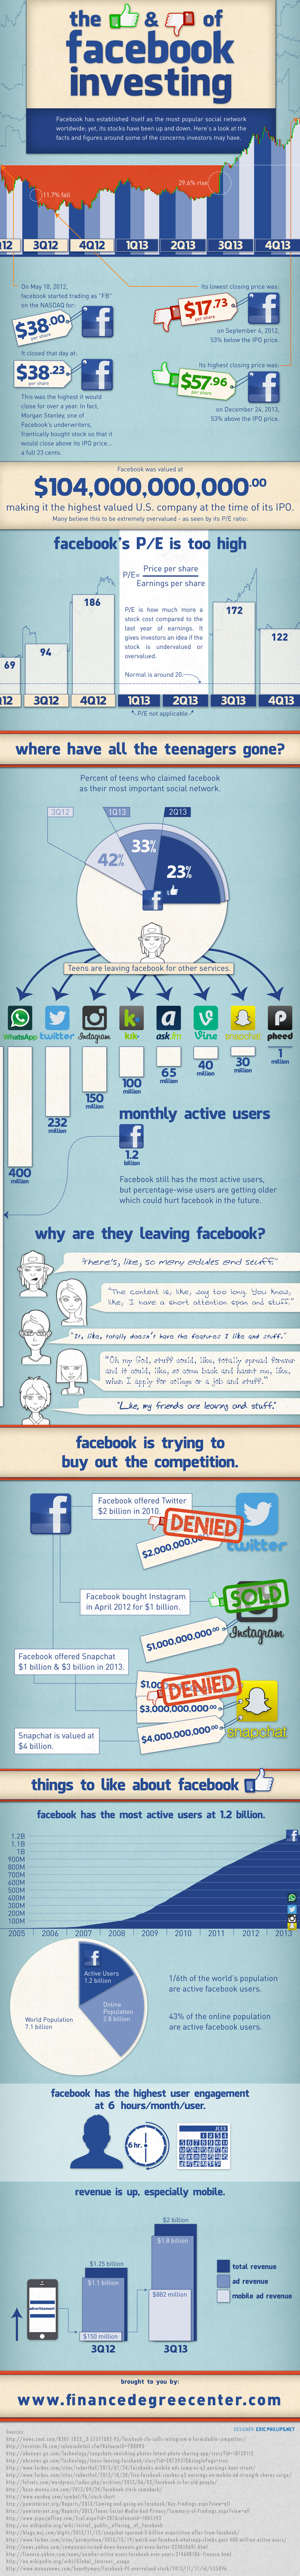
Should Facebook investors be concerned?
Facebook has established itself as the most popular social network worldwide, yet its stocks have been up and down. Here’s a look at the facts and figures around some of the concerns investors may have
-
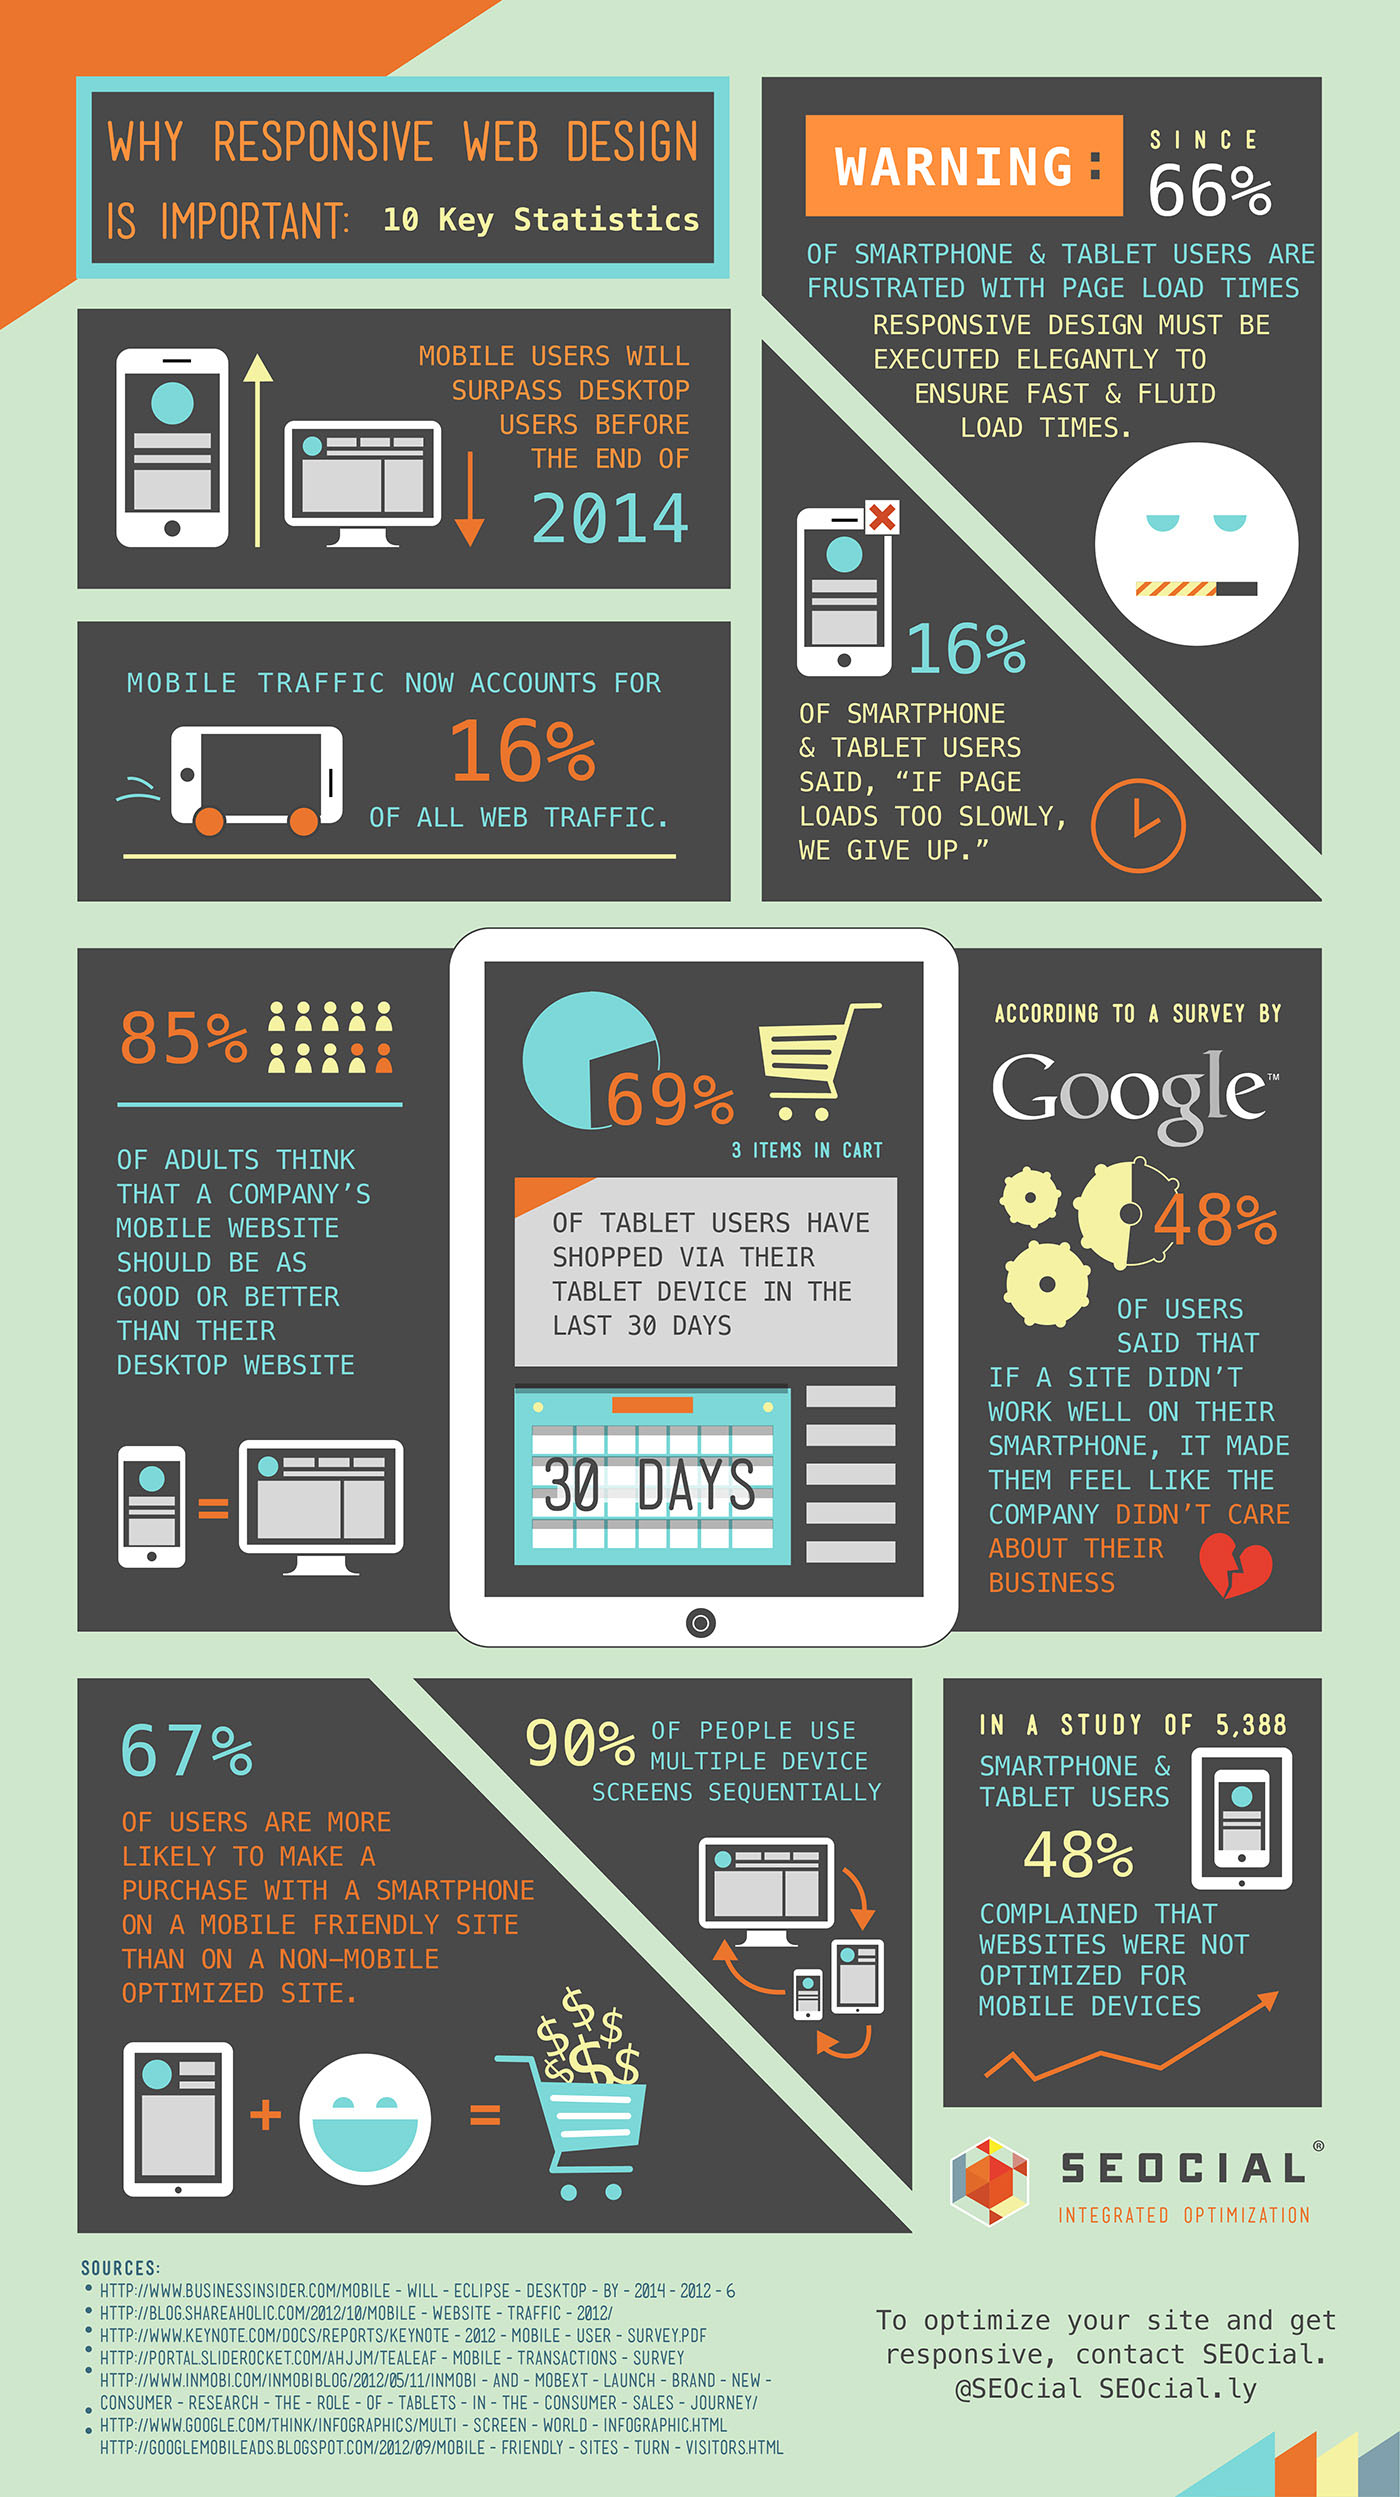
Responsive Web Design Statistics
10 key statistics that describe why responsive web design is so important!
-
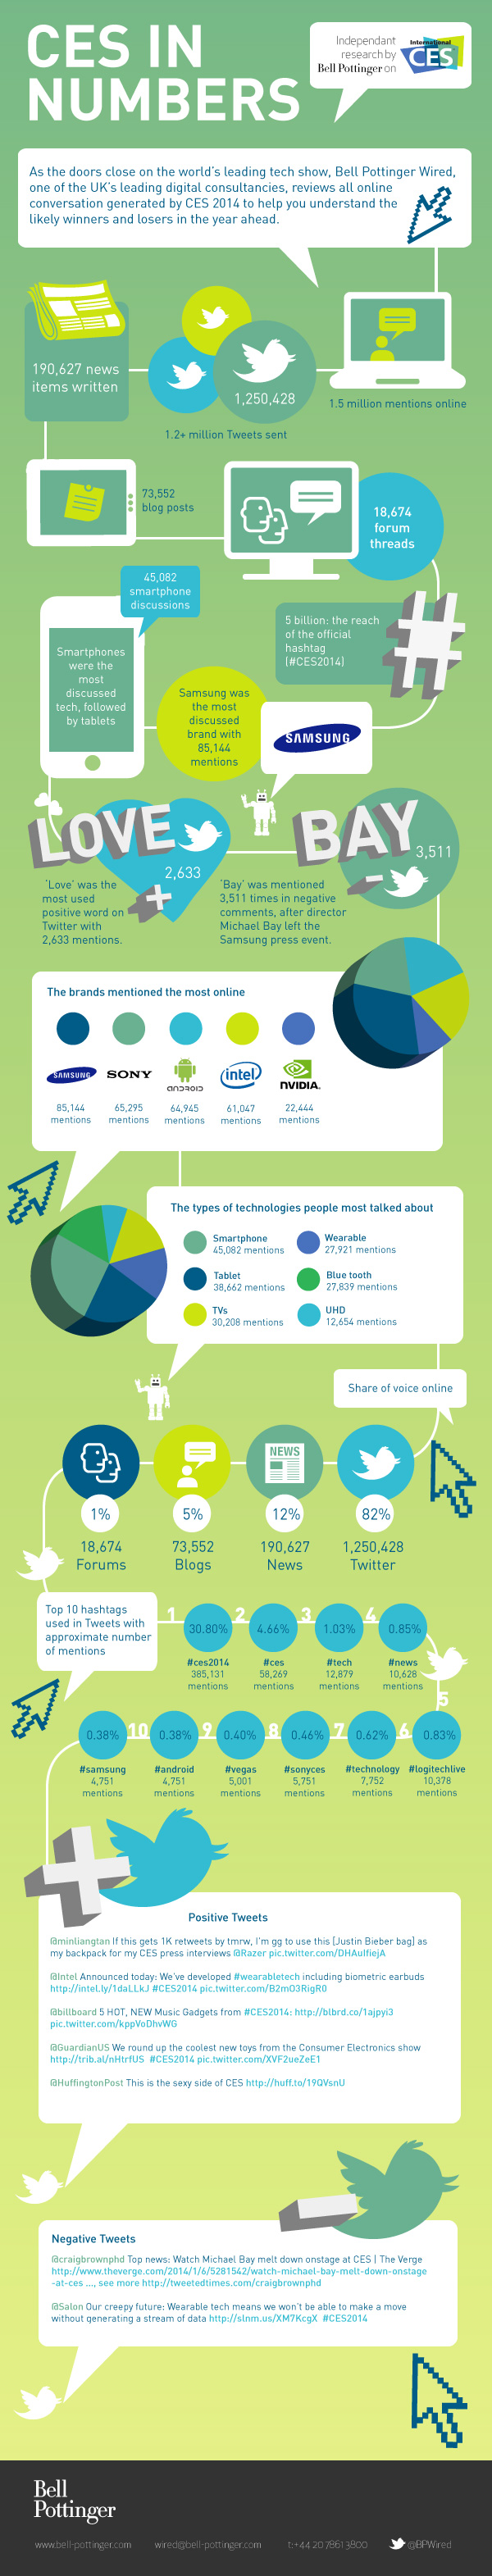
CES 2014 in Numbers by Bell Pottinger Wired
Research by Bell Pottinger Wired, one of the UK’s leading digital consultancies, reveals that this year’s Consumer Electronics Show (CES) was mentioned more than 1.5 million times online, across media sites, blogs, forums and social networks, such as Twitter. Insights into online conversations around the event, held in Las Vegas on 7 to 10 January…
-
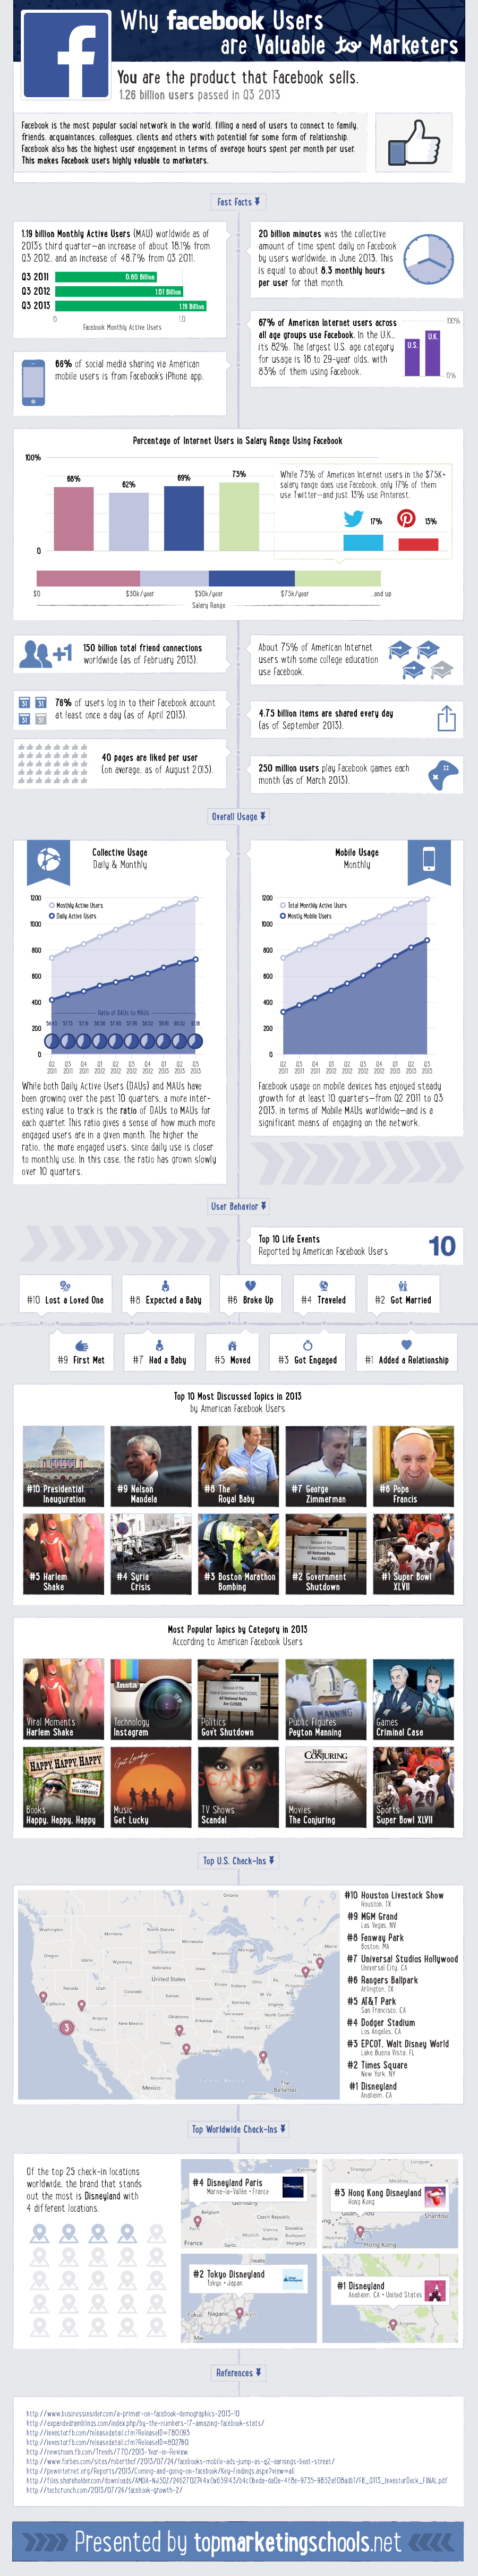
Facebook for Marketers: The Numbers
Facebook is the most popular social network in the world, filling a need of users to connect to family, friends, acquaintances, colleagues, clients and others with potential for some form of relationship. Facebook also has the highest user engagement in terms of average hours spent per month per user. This makes Facebook users highly valuable…
-
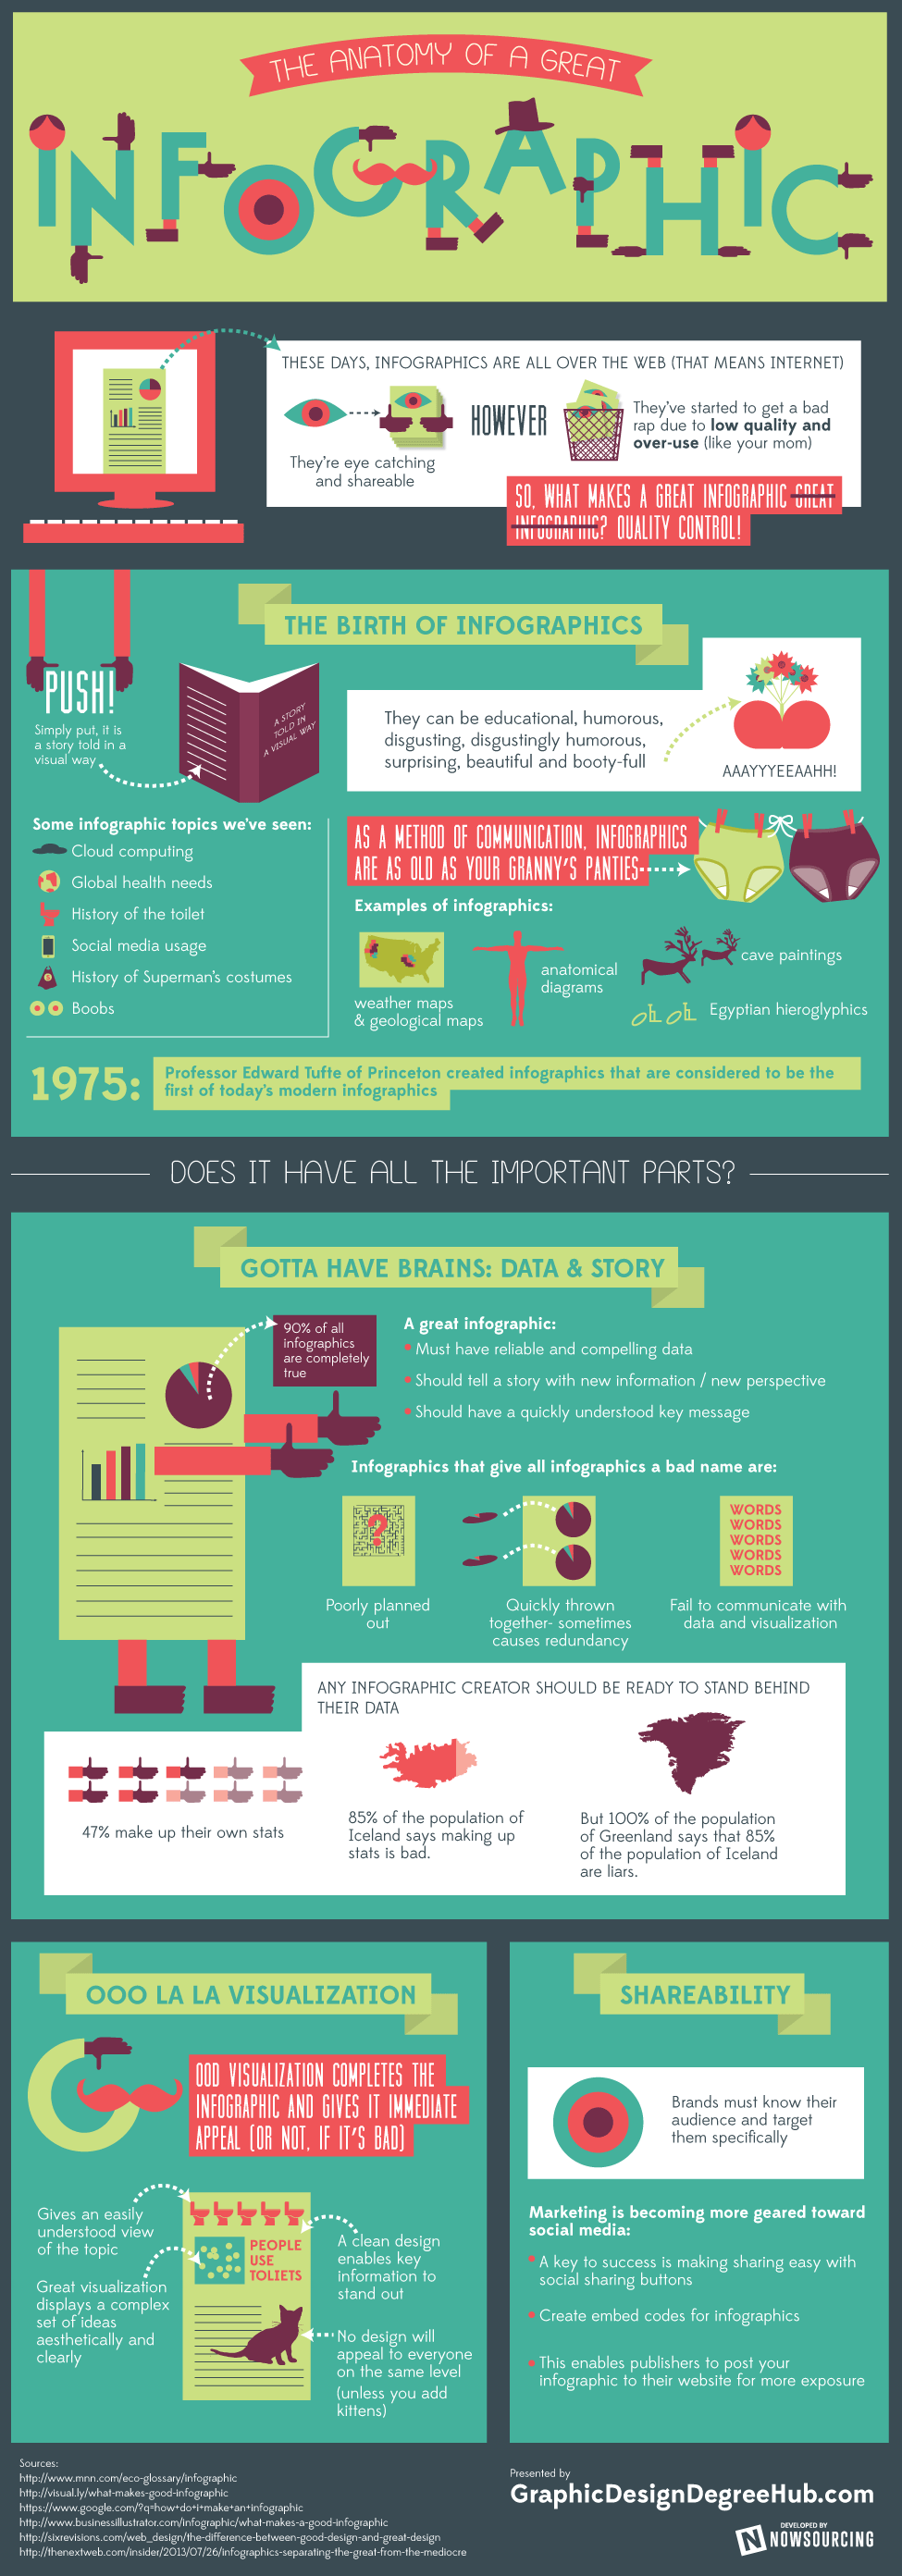
The Anatomy of a Great Infographic
Check out this infographic about what makes a great infographic. The stats and humor make it a must read.
-

Most Influential Scientists of 2012
Discover the top influential scientists of the past year, spanning the areas of genetics, physics, statistics, medicine, and more. Meet people from NASA, Science Exchange, Yale and National Geographic! Produced by: bestcollegereviews.org
-

Wikipedia – Facts & Figures
Incredible statistics and interesting historical facts on Wikipedia. Numbers of articles, users, languages.
-

LinkedIn Facts & Figures
Large infographic about LinkedIn – statistics, demographics, global reach and history. Information on users, companies, countries and advertising.