Category: Food & Health Infographics
-

What is Hoarding?
This infographic gives information on the symptoms of hoarding and how many people it effects as well as what it can do mentally, physicially and financially to those involved.
-
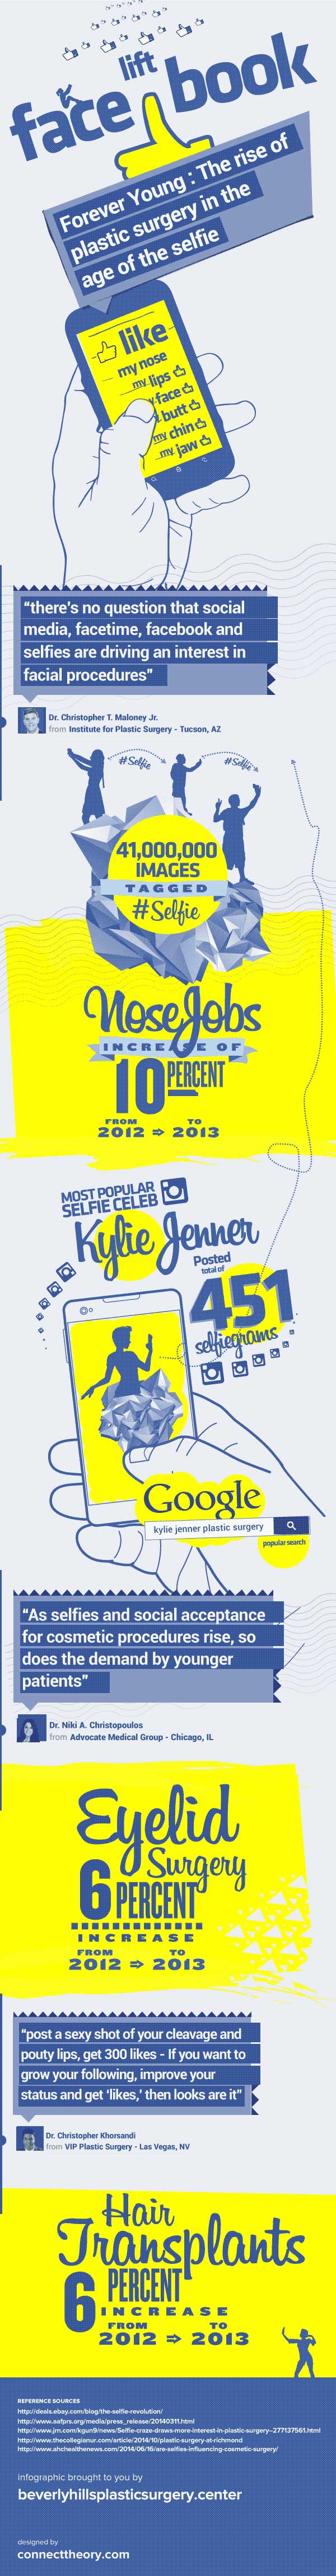
Face “lift” book
This piece explores the connections between the rise of selfies and the uptick in plastic surgeries (especially for 20 somethings).
-
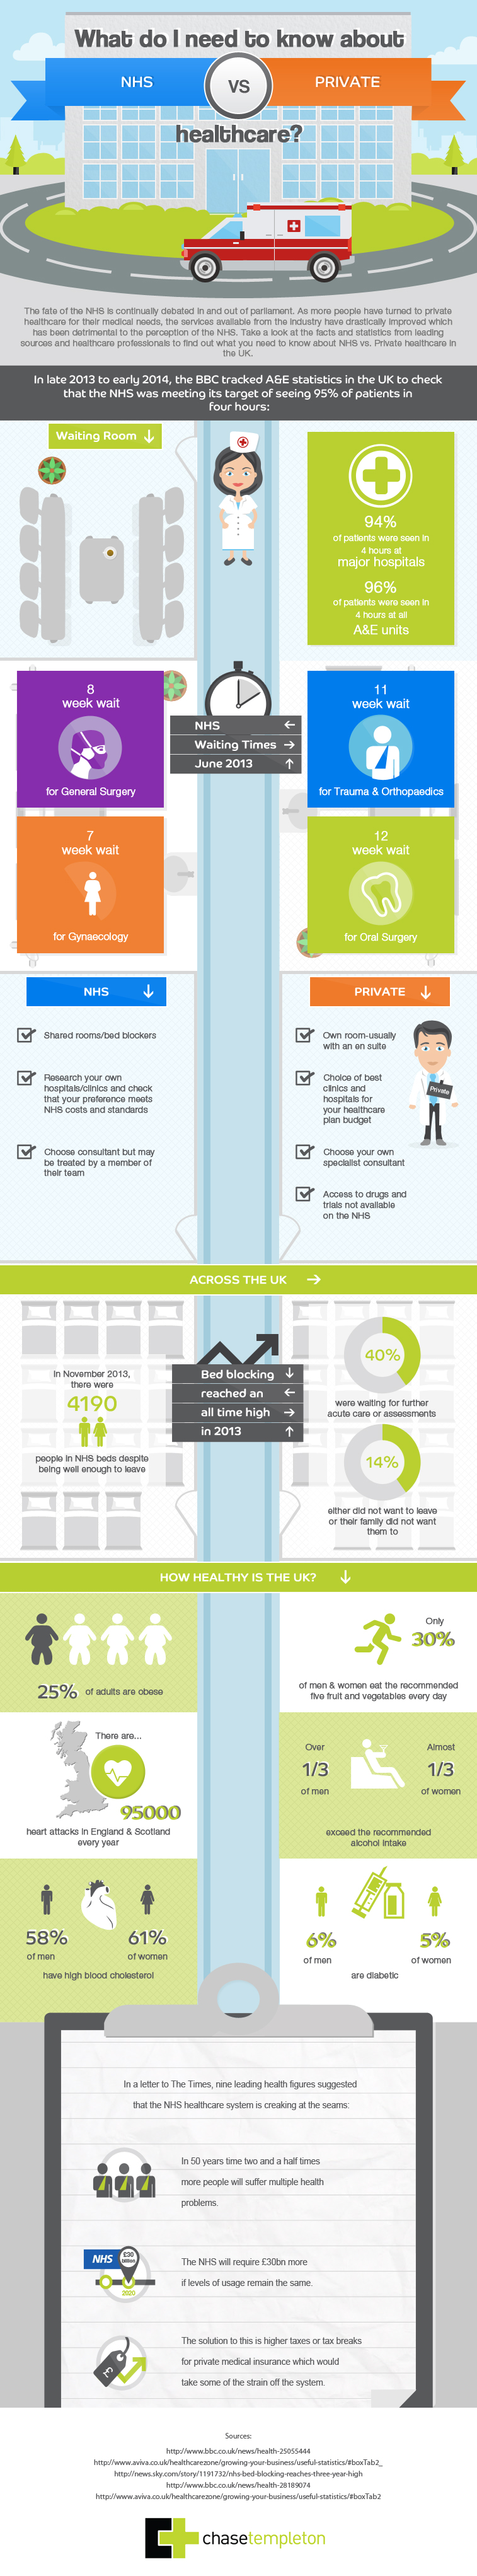
What do I need to know about NHS healthcare vs. Private healthcare?
The NHS is under constant scrutiny from both the press and the public and as a government funded body, struggles to meet the standard of care that private healthcare companies are able to meet. This infographic takes a look at some of the key issues facing the NHS, from waiting times to bed blocking, in…
-
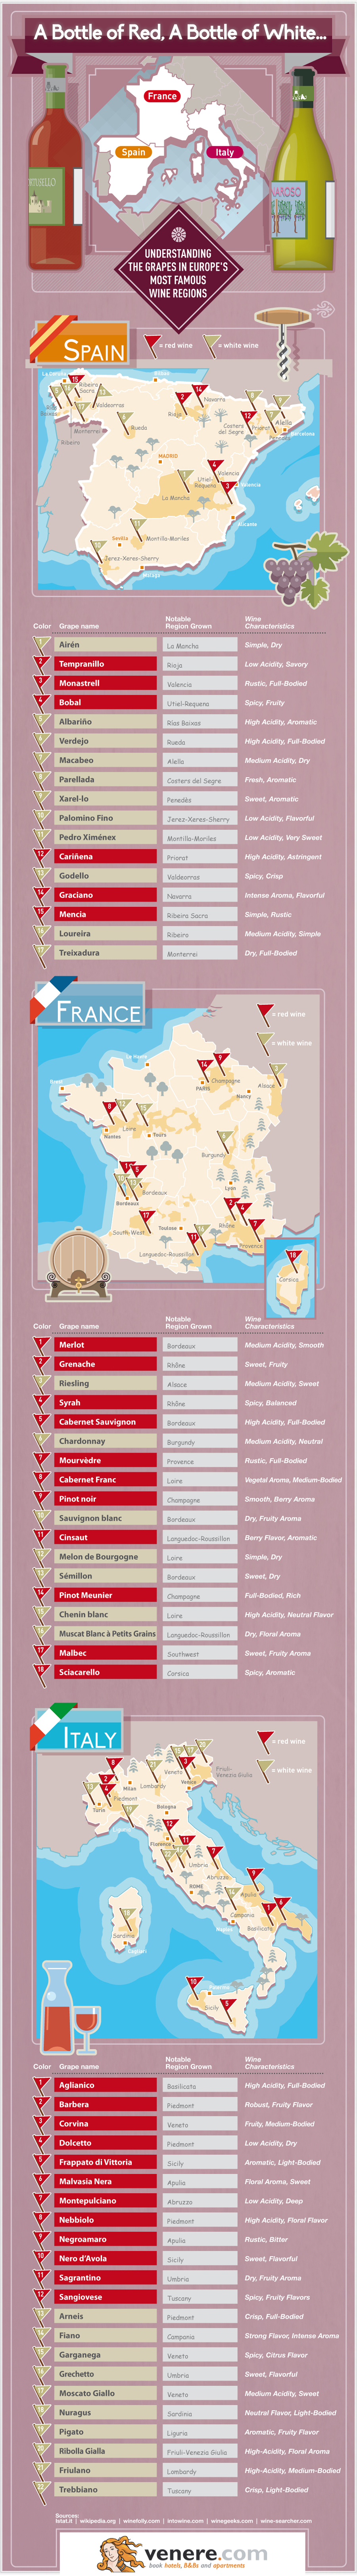
A Bottle of Red, A Bottle of White.. A Wine Map of Southern Europe
Wine is made from grapes right? Yes that is true, but did you know there are thousands of grape varieties grown all over the world? In Southern Europe, the mecca of wine enthusiasts with a rich history of wine production, this holds especially true. In France, Italy and Spain, each country has it’s own unique…
-
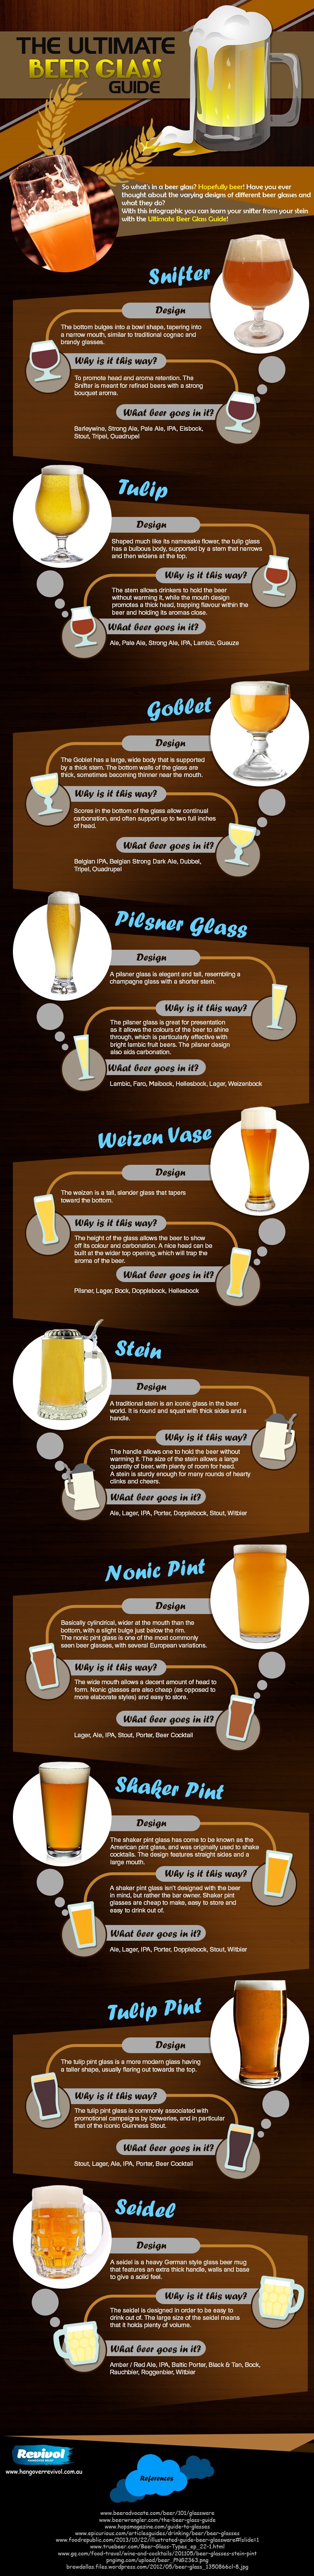
The Ultimate Beer Glass Guide
The rise of craft beer there has been in influx in the amount of unusual glasses that accompany alcoholic beverages.
-
Coffee Consumption
Find out about coffee, who drinks the most, where it comes from and even how it was first discovered!
-
Top New Year’s resolution Google searches
This infographic looks at how health-related search behavior on Google changes during the time people make New Year’s resolutions. There are increased searches during the first week of January for realistic weight-loss goals instead of the quick weight loss searches that are prevalent throughout the rest of the year. Healthcare organizations and marketers can use…
-
You won’t believe what Pakistani’s Food Industry ate the most last year!
EatOye food review, we are all moving to 2015 so EatOye took the oppurtunity to review 2014 for food lovers – enjoy the infographic.
-
Your Shoulder To Lean On: Being a Recovery Ally
Addiction recovery is a community effort. It takes all kinds of people, working together, to beat addiction. For our loved ones who are suffering from substance abuse, but who want to get help, we can lift them up by being good recovery allies. It can be overwhelming to try and think of the best way…
-

Your Baby’s Size Week by Week
The infographic is divided into the three trimesters of pregnancy. In each trimester, there are cute and humorous illustrations comparing baby’s growth to a fruit or vegetable for each and every week. From a poppyseed to a plum, to a sweet potato and all the way through to a jackfruit, let this infographic guide you…