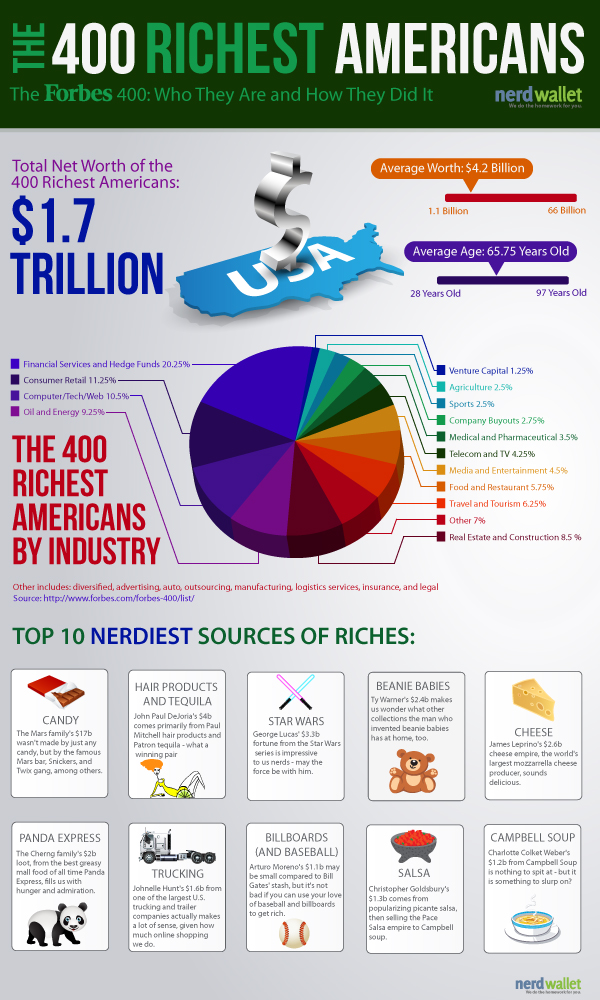
NerdWallet’s Forbes 400 infographic breaks down the numbers behind the Forbes 400 Richest Americans to find out which industries are the most prominently represented by the superrich. It breaks down the data provided in the Forbes 400: The Richest People in America list of billionaires and shows how, of the 400 richest Americans, just over half made their fortunes in either finance, retail, tech, and oil & energy (the top 4 represented industries on the list). The NerdWallet Financial Markets team empowers investors by providing unbiased and transparent access to information on politics, the economy, and financial markets.
Infographic: How the Forbes 400 Richest Americans Got Rich
by
Tags:
Leave a Reply
You must be logged in to post a comment.